 Download:
Figures of the Article
-
![]() Comparisons of Young’s moduli (E) and shear moduli (G) for the (a) Cu64Zr36, (b) Ni45Ti20Zr25Al10, (c) Fe80P13C7 and (d) Fe74Mo6P13C7 glassy samples and their components. (a1)(d1) XPS spectra and electronic densities of states for the Cu64Zr36, Ni45Ti20Zr25Al10, Fe80P13C7, and Fe74Mo6P13C7 glassy samples, respectively.
Comparisons of Young’s moduli (E) and shear moduli (G) for the (a) Cu64Zr36, (b) Ni45Ti20Zr25Al10, (c) Fe80P13C7 and (d) Fe74Mo6P13C7 glassy samples and their components. (a1)(d1) XPS spectra and electronic densities of states for the Cu64Zr36, Ni45Ti20Zr25Al10, Fe80P13C7, and Fe74Mo6P13C7 glassy samples, respectively.
-
![]() Relationship between yield strength
Relationship between yield strength y (a), Young’s modulus E (b), shear modulus G (c), Tg, and structural vector q1 for 57 MGs [40]. -
![]() Relationship between yield strength
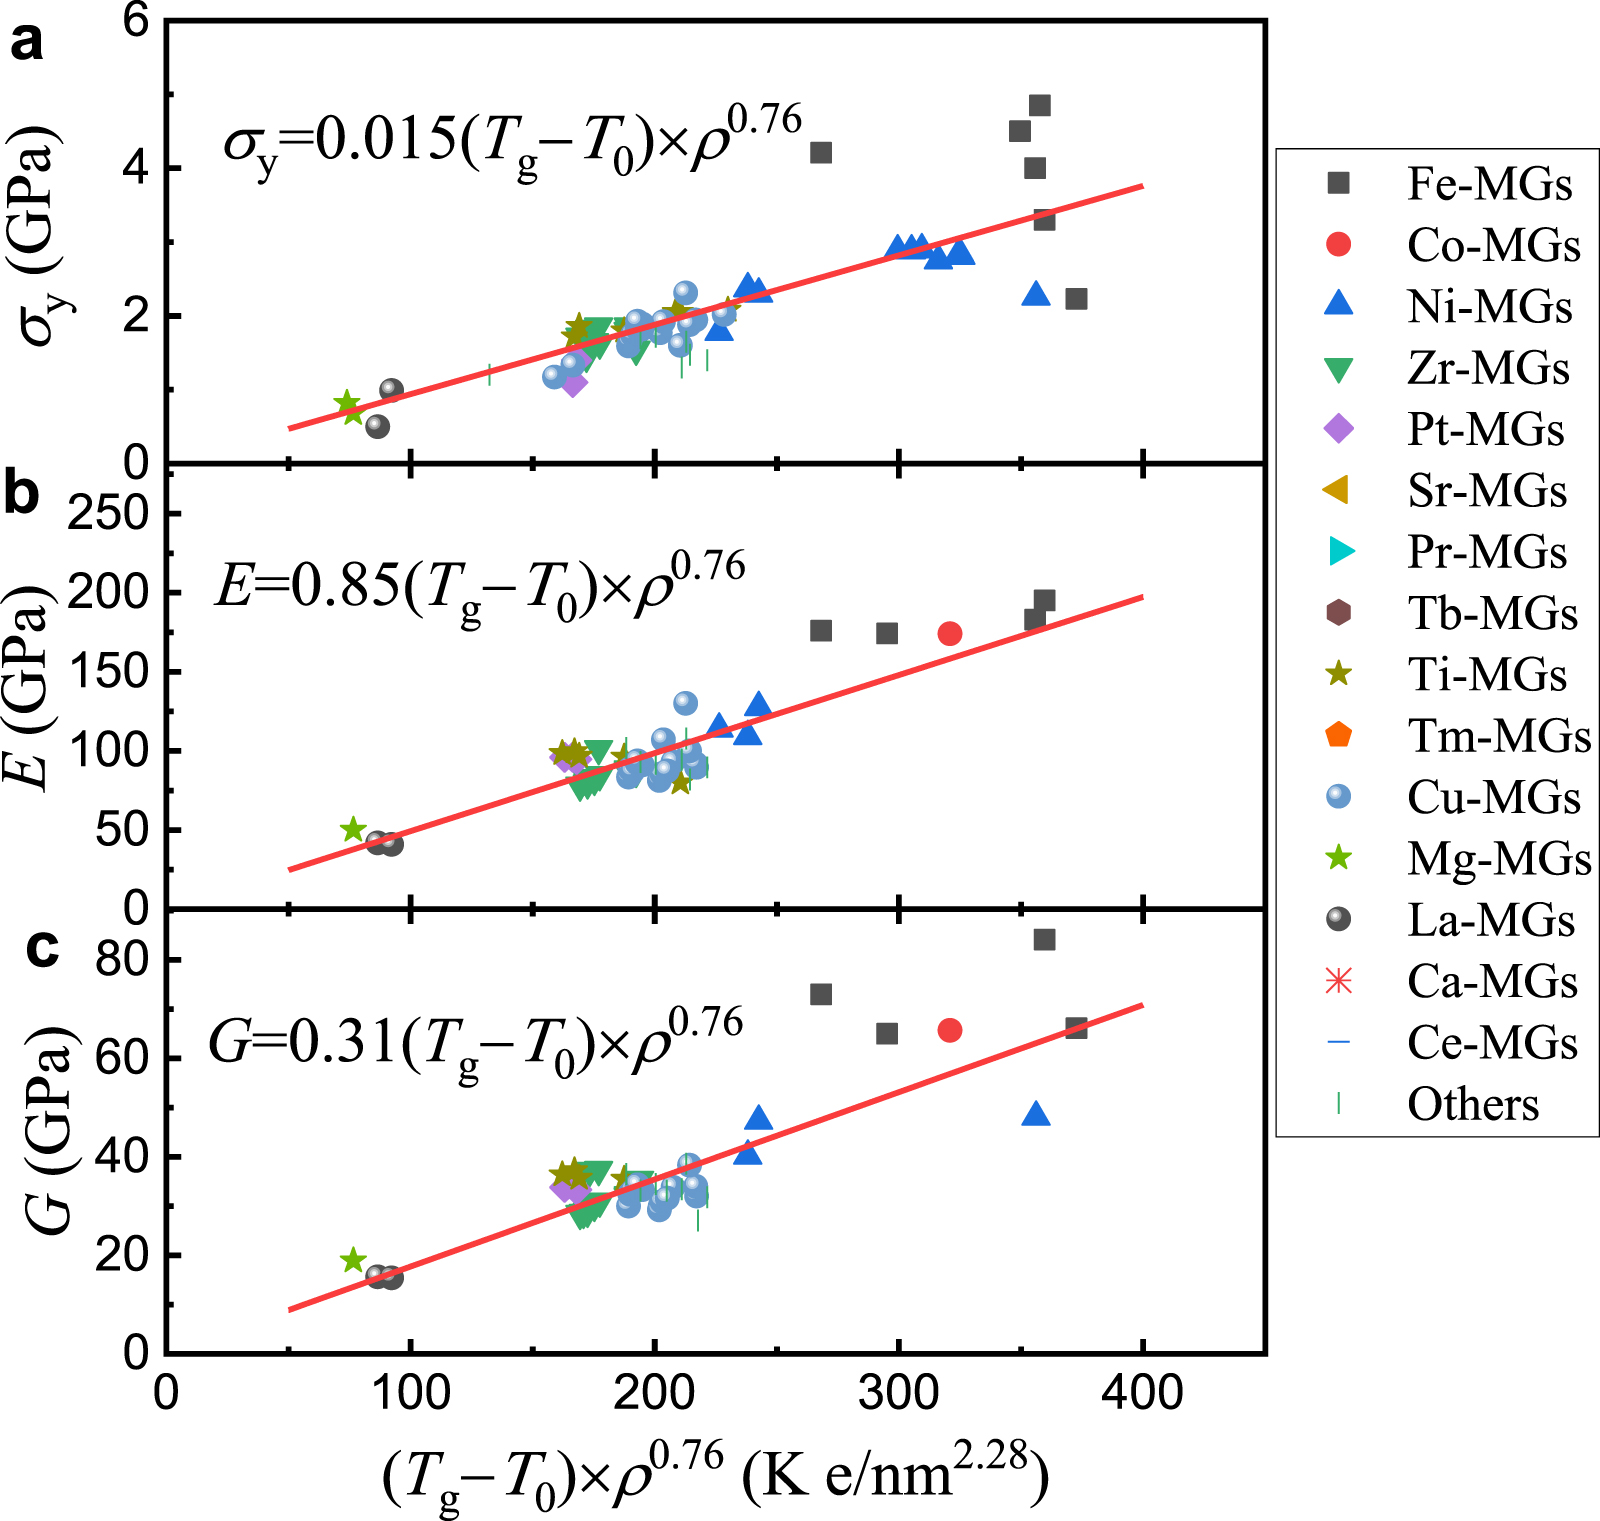
Relationship between yield strength y (a), Young’s modulus E (b), shear modulus G (c), glass transition temperature Tg, and valence electron density for a variety of MGs [14, 24, 40]. -
![]() Specific heat Cp of the MGs in the temperature range from 3 to 33 K. (a) Specific heat plotted versus the temperature. (b) Specific heat, shown as Cp /T vs T2, where the solid lines are the results of the fitting of the specific heat data to Cp/T=
Specific heat Cp of the MGs in the temperature range from 3 to 33 K. (a) Specific heat plotted versus the temperature. (b) Specific heat, shown as Cp /T vs T2, where the solid lines are the results of the fitting of the specific heat data to Cp/T= + T2. (c) Histograms of D for MGs and one of their dominant components. -
![]() Relationship between yield strength
Relationship between yield strength y (a), Young’s modulus E (b), shear modulus G (c), glass transition temperature Tg, and low-temperature coefficient of the electronic specific heat for 15 MGs. -
![]() Experimental values [63] of the linear term temperature coefficients i of electronic specific heat for a great number of elements.
Experimental values [63] of the linear term temperature coefficients i of electronic specific heat for a great number of elements.


Related articles
-
2025, 4(2) DOI: 10.1088/2752-5724/add7f3
-
2025, 4(2) DOI: 10.1088/2752-5724/add415
-
2025, 4(2) DOI: 10.1088/2752-5724/adda68
-
2025, 4(2) DOI: 10.1088/2752-5724/adb50a
-
2025, 4(1) DOI: 10.1088/2752-5724/ad9493
-
2025, 4(1) DOI: 10.1088/2752-5724/ada172
-
2023, 2(2) DOI: 10.1088/2752-5724/acbdb4


